
Managing your money is a lot like driving a car.
You need to be aware, focused and informed. Not just of what is happening around you on the road, but also about the energy available and performance of your vehicle.
And, to give you a quick overview of this, there is a compact dashboard or control panel right under your steering. This makes sure that you get all and only the information you need at the time you steer your vehicle.
Similarly, when you manage your finances, you need to be aware, focused and informed. Not just of the big numbers like net worth and debt, but also about your financial health in general.
To quickly identify problems and take meaningful money decisions on the go, you need something like a financial control panel.
To help you steer your way to a richer, more financially healthier life, we’ve introduced the Wallet Dashboard in our latest update, Wallet 6.
What is the Wallet Dashboard?
Wallet Dashboard is a powerful, new widget on your Wallet Now screen, which will give you a quick overview about your financial health and provide answers to your most pressing financial questions.
The Wallet Dashboard looks very similar to your car’s dashboard and is a simple financial control panel that’ll give you a quick, visual representation of what your money did in the past 30 days. It also provides you a forward-looking outlook for the next 7 days to help you prepare better to manage your finances well without moving into a danger zone.
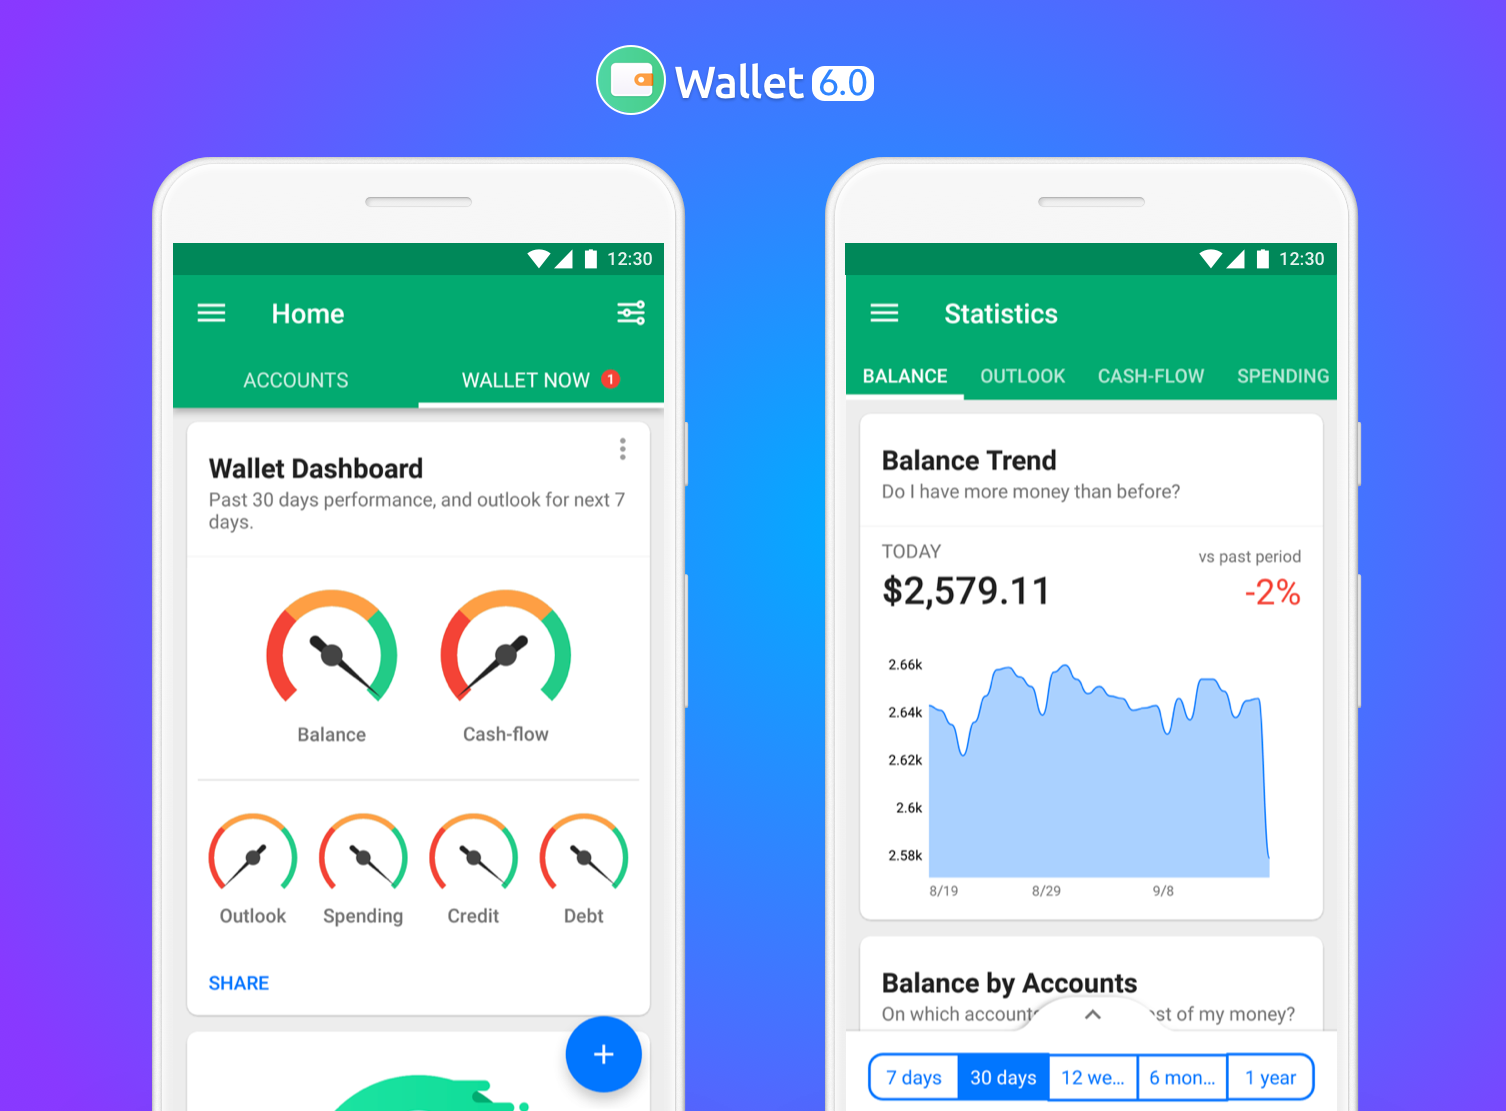
The 6 Financial Meters
There are 6 new financial meters on the Wallet Dashboard: Balance, Cash Flow, Outlook, Spending, Credit, and Debt.
Simply put, if all of them are green, then your finances are in pretty good shape and you don’t need to worry. If one or more of them are orange, you may need to take a deeper look at your finances and make some changes. And, if any of them are red, your money needs your immediate attention.
So what do these meters indicate?
The Balance Meter: This is an indication of your overall financial well-being. The Balance Meter will be green if the balance on your selected accounts is at least 2 times more than your expenses in the past month. It will be red if your expenses exceed your balances.
The Cash Flow Meter: This meter indicates your real cash flow or the difference between your income and expenses. The Cash Flow Meter will be green if your income is at least 2 times more than your expenses in the past month. It will be red if your expenses exceed your income.
The Cash Flow Meter is different from your Balance Meter as the latter shows all your balances and compares it to your expenses, whereas the former only considers your income and expenses in the given period.
For instance, your balance could be 1000EUR this month, of which 500EUR was balance carried over from the month before, and 500EUR is your income in this month. So the Balance Meter compares 1000EUR against your expenses, whereas the Cash Flow Meter compares only 500EUR.
The Outlook Meter: This meter gives you an insight into what lies ahead for you. It shows whether you’ve Planned Payments to make in the coming week and whether your existing balance would be enough to cover them. The Outlook Meter will be green if there are no Planned Payments scheduled for the next 7 days. It will turn red if the Planned Payments scheduled for the next week are more than 50% of your available balance. Thus, this meter helps you manage your money well for the next week, knowing what your possible expenses may be.
The Spending Meter: This meter shows your spending in the current month in relation to your spending in the previous month. The Spending Meter will be green if your spending in the current month is at least 30% lower than your spending in the previous month. The meter will turn red in case your spending in the current month increases by 30% than the spending in the previous month.
The Credit Meter: This meter shows if your credit is in check. If your credit card balances and overdraft balances are 0, your credit meter will be green. It will turn red if the actual balance of your credit card or overdraft is 50% higher than your credit limit.
The Debt Meter: This meter shows if your debt to income ratio is in check for the given period. If you have no recurring debt payments in the current month, your Debt Meter will be green. It will turn red when your recurring debt payments exceeds 30% of your income in the given period. This meter gives you a heads up to be aware of whether your income would be sufficient to pay off your debt payments in the current period.
By tapping on each of these 6 meters, you’ll be taken into detailed Statistics section on the selected area of their finance.
Tip: Tap on the three dots on the top right corner of the Wallet Dashboard widget to choose the accounts for which you want to see these meters for.
What else has changed?
With the update to Wallet 6, the Charts and Reports sections in your Main Menu will now be replaced by a brand new section called Statistics.
The Statistics section now includes six different tabs representing various statistics about your Balance, Outlook, Cash Flow, Spending, Credit and Financial Reports.
The Balance tab shows you how your balance has changed with time, how it differs between different accounts and currencies.
The Outlook tab shows you your Planned Payments by category, a timeline of your Planned Payments and a forecast for your Balance for the next period.
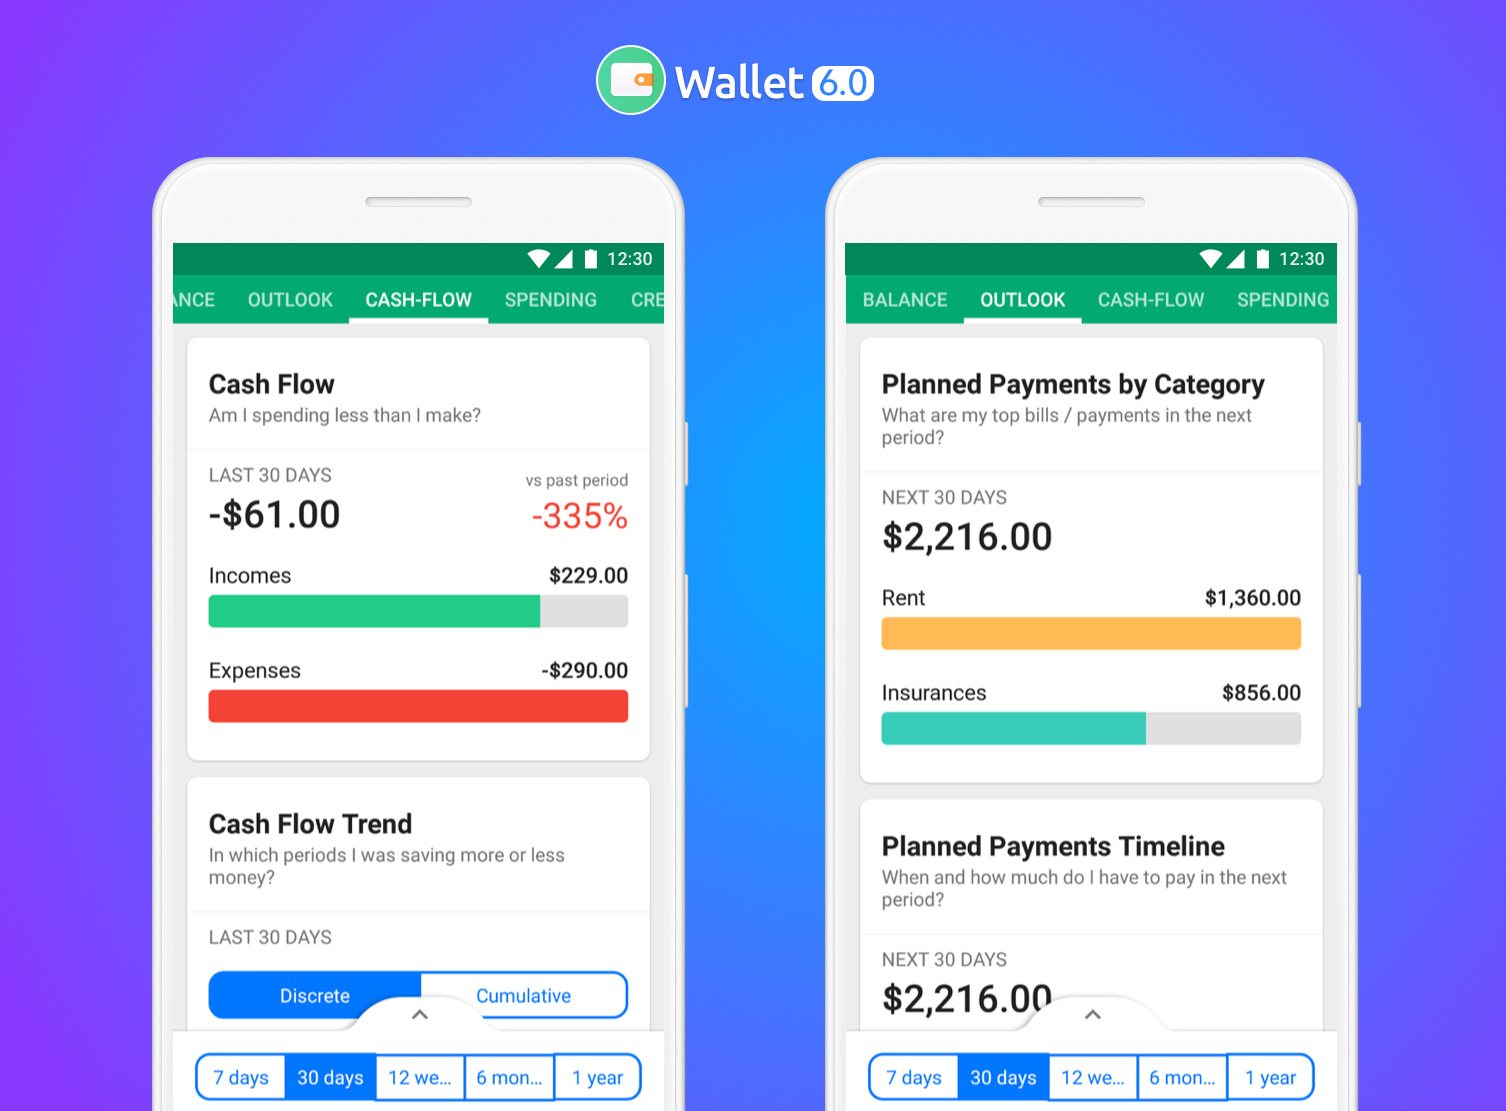
The Cash Flow tab shows your actual cash flow, how your cash flow has changed with time and how the current period’s cash flow compares to the same period in the previous year.
The Spending tab shows you your actual Spending by categories and Labels and gives you a breakdown of your spending based on your needs and wants.
The Credit tab shows how much of your credit limit you’re using as of now, which credit resources you use the most, your debt-to-income ratio and the debt payments you made in the given period.
The final tab or the Reports tab gives you a Cash Flow Table and a conventional Income & Expenses Book.
Finally, Ready to take a look at the Wallet Dashboard?
Great! Just update to the latest available version of Wallet.
Note: Wallet Dashboard is currently available on Android devices. It is coming really soon to Wallet for iOS!
You’ll soon learn more on how to use these meters, charts, and reports to take better money decisions on the go. Till then, enjoy the latest awesome features on Wallet 6 and let us know your comments and suggestions on the same.
Let’s make Wallet better together!
Follow BudgetBakers on Facebook, Twitter, Linkedin, and Instagram to get more updates from us.